

Reporting & analytics
Show measurable progress quarter over quarter
Bring campaign, training, and reporting signals into one clear view of organizational resilience. Follow team trends, then open the detail you need to guide the next step.
From click to trend line
Start with the account risk score, campaign funnel, and team trends. Then move into a campaign, group, or recipient history when you need more context.
- The whole funnel at a glance — Sent through Trained, plus replies, on one screen.
- A program-level risk score highlights where additional practice can make the greatest difference.
- Move from organization to detail — account, group, department, and an individual timeline when appropriate.
- Trends that accumulate across campaigns, quarter over quarter.
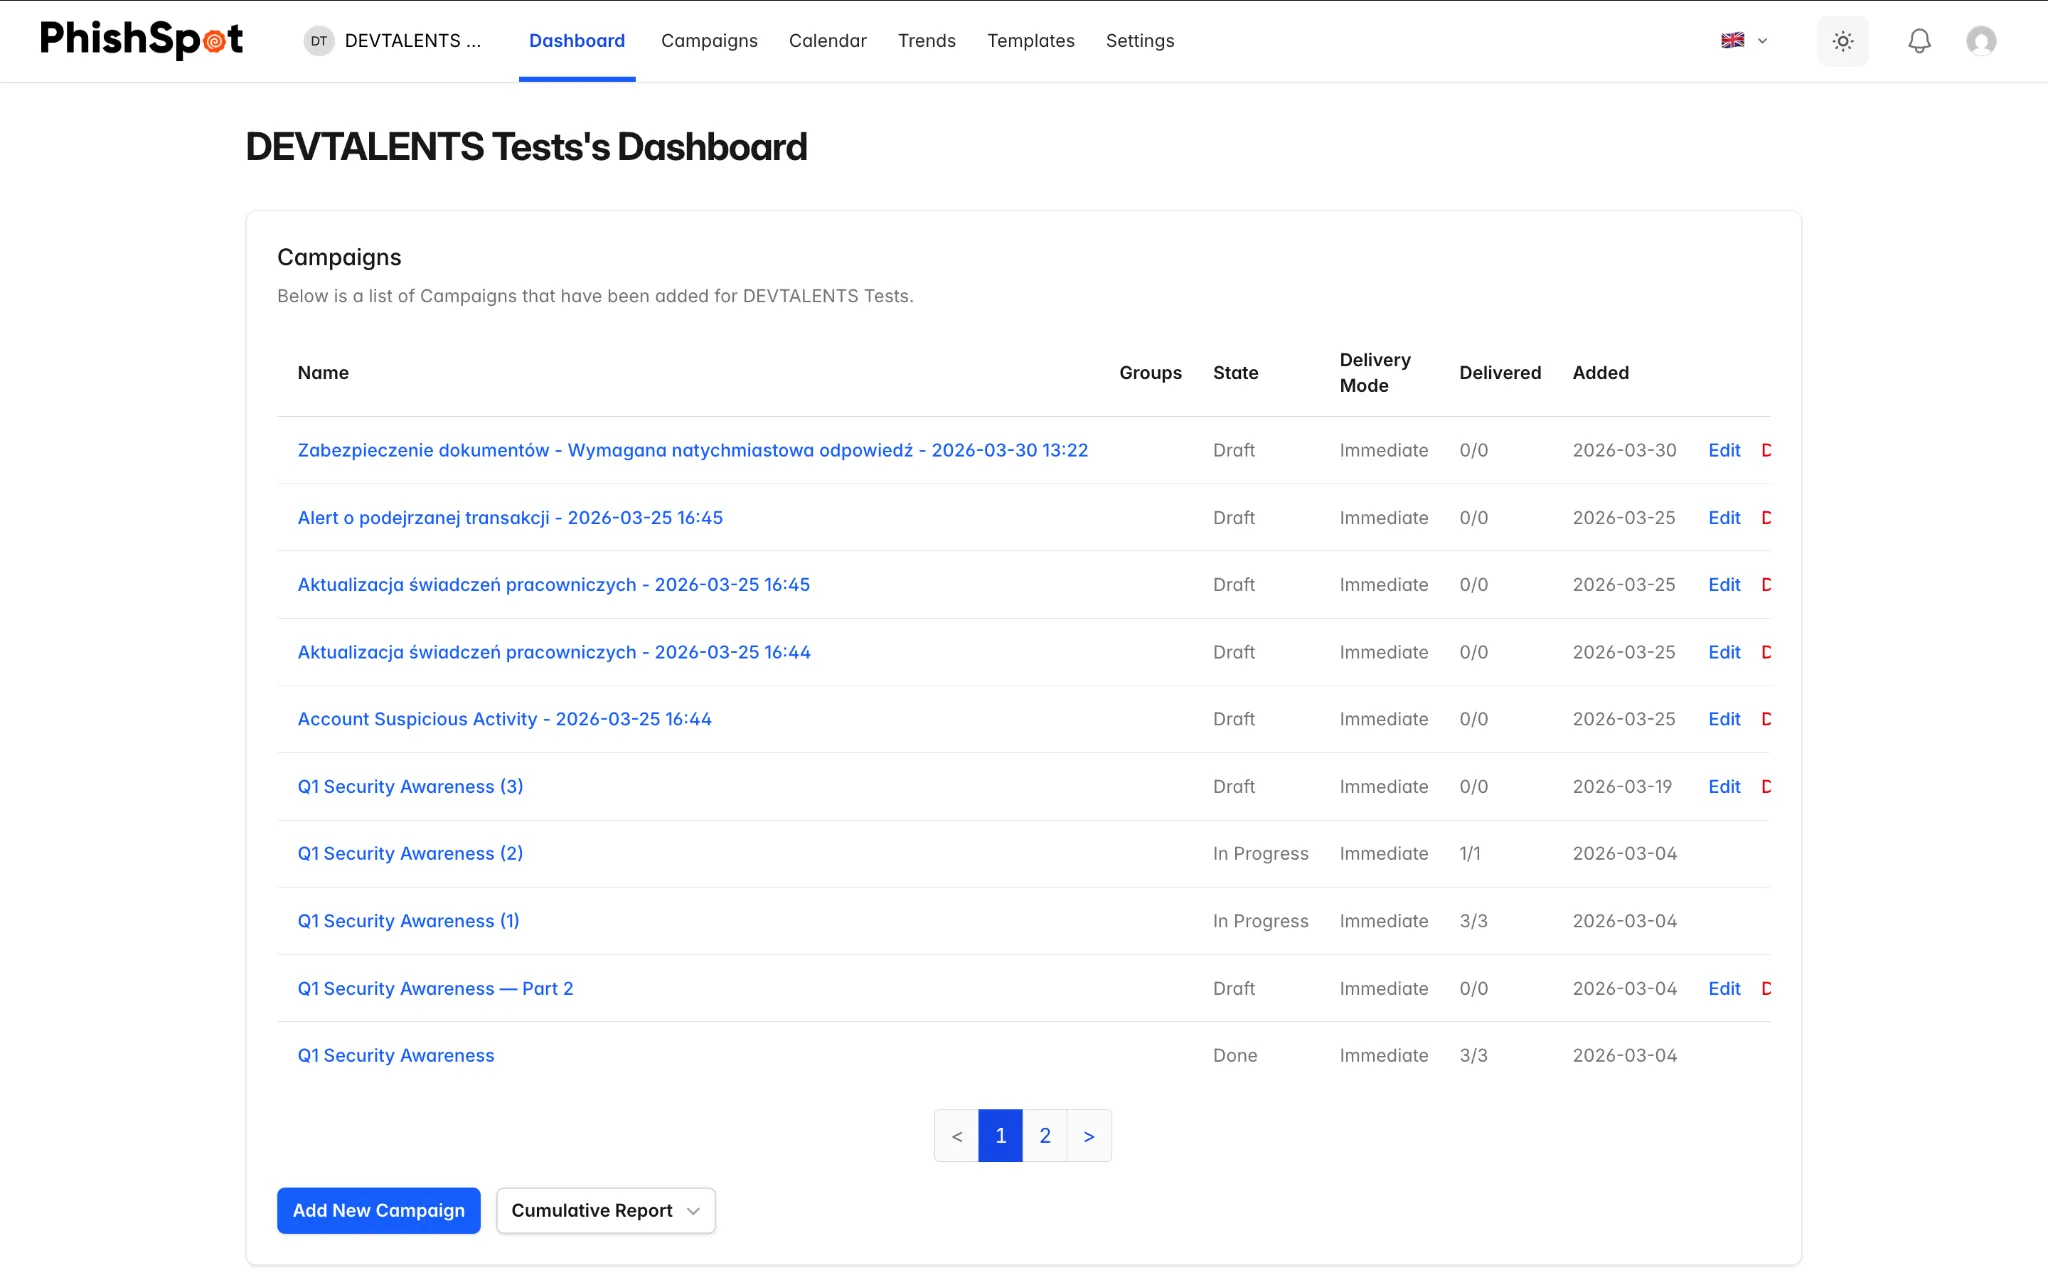
From campaign results to organizational resilience
See every stage in context: campaign, group, department, and change over time.
The full funnel
Track every stage of every campaign — Sent, Delivered, Opened, Clicked, Submitted and Trained, plus who Replied — so no signal is lost between send and outcome.
Group and department breakdown
Compare groups and departments to see where additional practice and tailored training can make the greatest difference.
A 0–100 risk score
Accounts, groups, and — in authorized views — recipients have a current 0–100 score. Use it to prioritize education and follow change over time.
Timelines and email previews
Authorized admins can review a recipient timeline and see opens, clicks, and submissions in the context of the message they received.
Anonymized reporting
Share outcomes and trends without naming individuals. Anonymized reports support no-blame cultures, works councils, and privacy-conscious teams.
Exports and trends
Export to PDF, DOCX, Markdown, RTF and CSV. Trend and cumulative dashboards line up campaign after campaign so you can prove risk is falling over time.
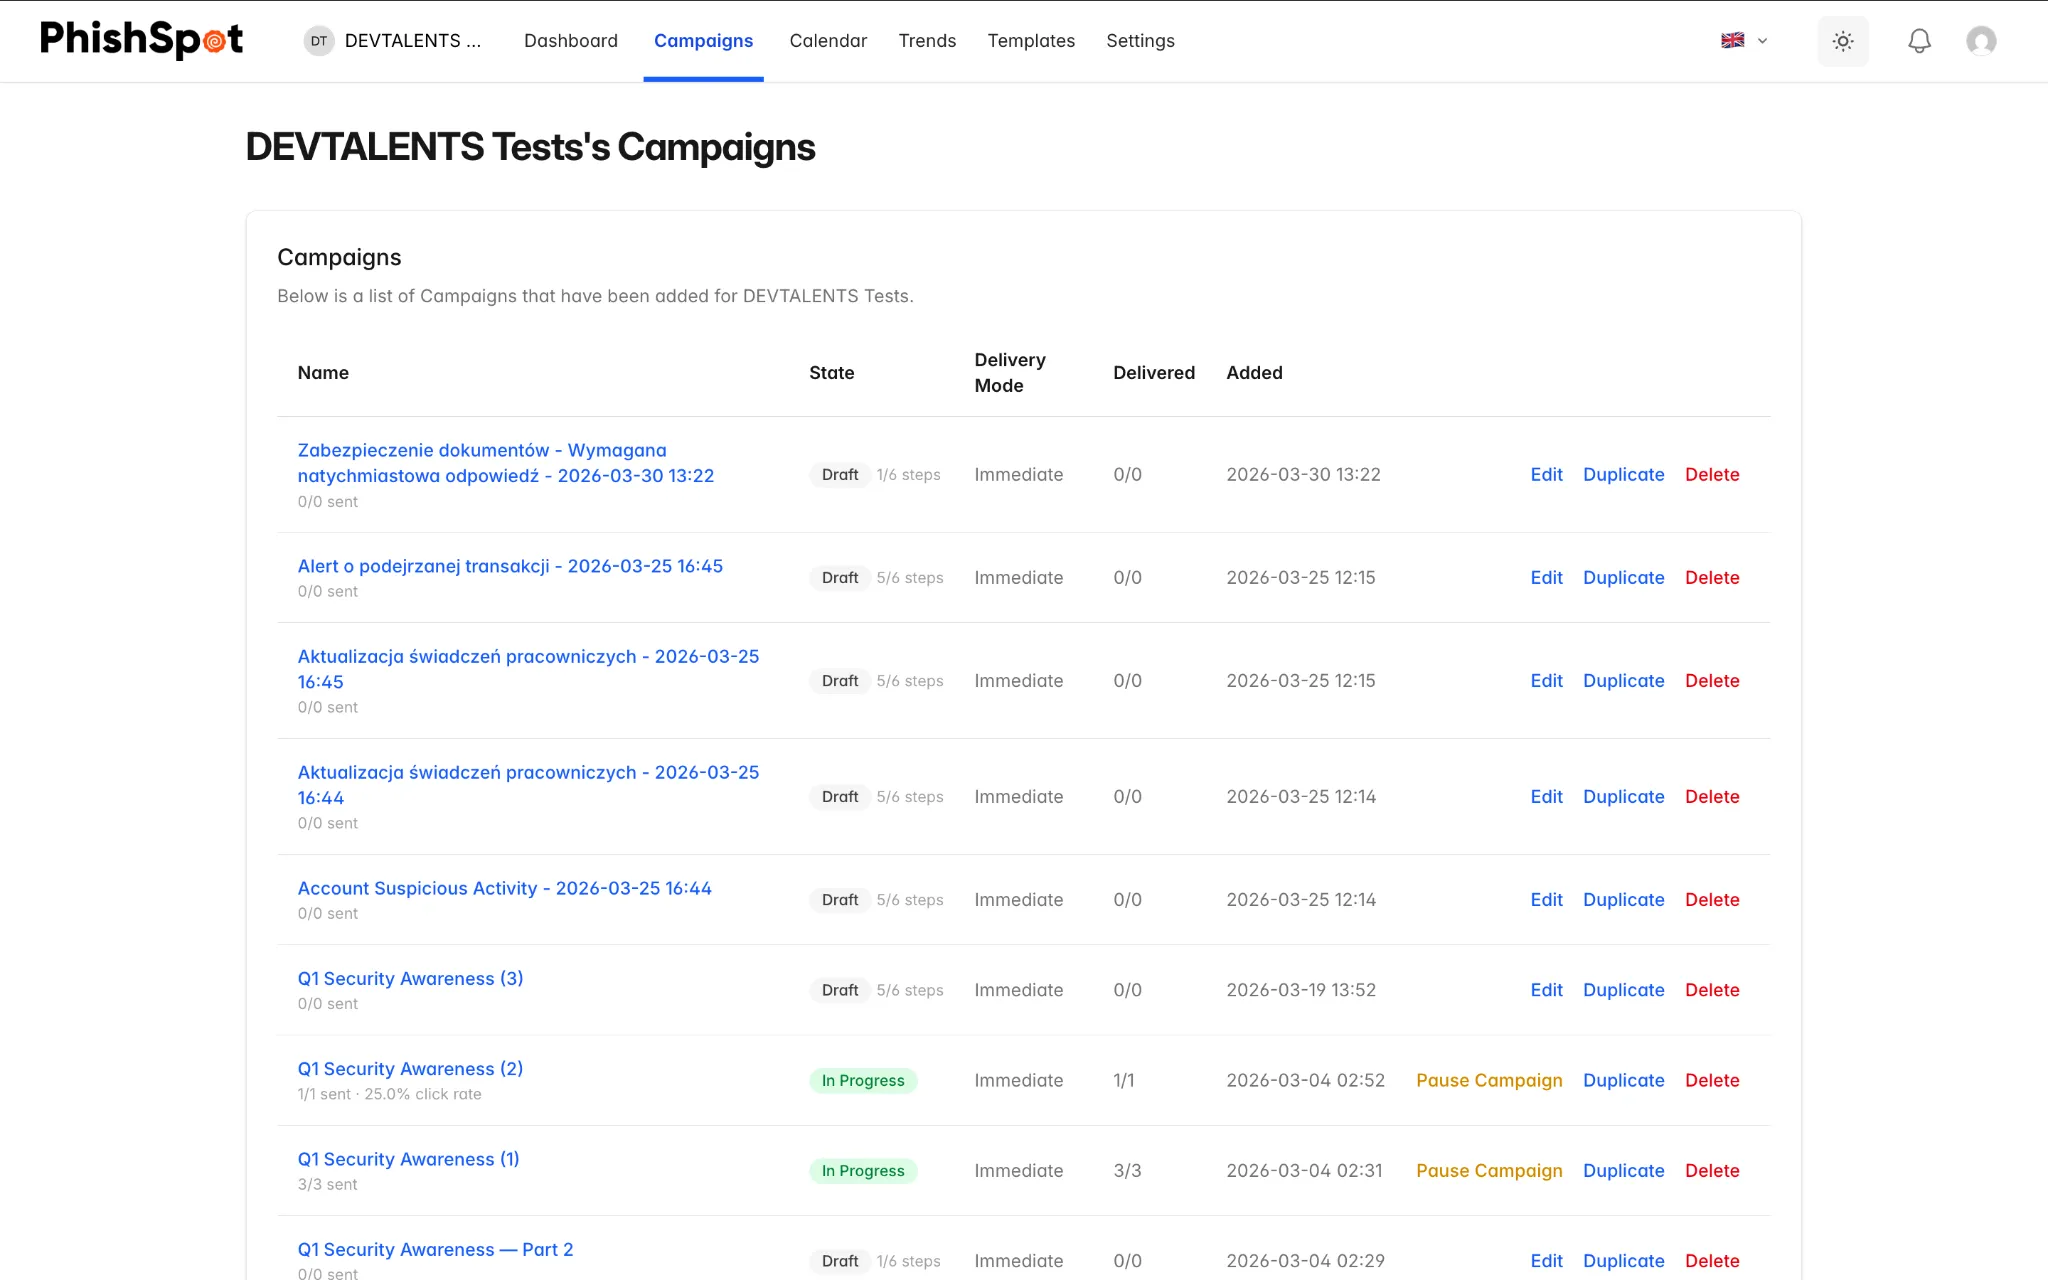
Every campaign, in one place
The campaigns index shows status and headline results for every send at once — so a program of dozens of simulations stays legible.
- Status and results per campaign — click rate and submissions without opening each one.
- Cumulative reporting rolls many campaigns into one program view.
- Compare rounds over time to see whether training is working.
- Export any view to PDF, DOCX, CSV and more for stakeholders.
6
Funnel stages
Sent → Delivered → Opened → Clicked → Submitted → Trained
0–100
Risk score
Low · Medium · High · Critical
5
Export formats
PDF · DOCX · Markdown · RTF · CSV
2
Languages
English and Polish
Reporting, answered
What stages does the funnel track?
Six core stages for every campaign: Sent, Delivered, Opened, Clicked, Submitted, and Trained — plus replies. Analyze each stage at campaign, group, and authorized recipient level.
How is the risk score calculated?
The 0–100 score reflects behavior across simulations, completed training, and correct reporting. It updates with the program and helps teams tailor further education; it is not designed for public employee ranking.
Can I share results without exposing individuals?
Yes. Anonymized reports show outcomes and trends without naming employees — useful for board summaries, works councils, and privacy-sensitive cultures. Detailed histories remain available only to authorized admins.
What export formats are available?
Reports export to PDF, DOCX, Markdown, RTF and CSV. Use PDF or DOCX for stakeholders, CSV to feed a BI tool, and Markdown or RTF for lightweight sharing.
Show team progress with clear evidence
Bring campaign, training, and reporting results into a trend your board can understand.